Bias and Variance
Generalization
When fitting machine learning models to data, we want them to generalize well to the distribution that we have sampled from. We can measure a model’s ability to generalize by evaluating it on previously unseen data that is sampled from the same distribution as the training set. However, we often do not know the true underlying distribution. So we must fit the models to empirical distributions derived from observed data.
Measuring bias and variance is crucial for determining the quality of a model. Bias refers to the difference between the average prediction of a model and the correct value we are trying to predict. A model with high bias oversimplifies the problem and leads to high error on both training and test data. Variance refers to the sensitivity of a model to fluctuations in the training set. High variance suggests that the model’s performance changes significantly when it is fit on different samplings of the training data, which can lead to overfitting.
To achieve good generalization, it is essential to find a balance between bias and variance, minimizing the total error. This can be done by selecting appropriate model complexity and using regularization techniques to prevent overfitting or underfitting. Additionally, model validation techniques, such as hold-out validation and cross-validation, can be employed to assess a model’s ability to generalize to unseen data.
Bias
Consider fitting a simple linear model to nonlinear data. The model will not be able to generalize well, regardless of the size of the training set. In fact, it would also exhibit poor performance when evaluated on the training set as well. When a model has not learned the patterns in the training data and is likewise unable to generalize to new data, it is known as underfitting. In this case, such a model has high bias.
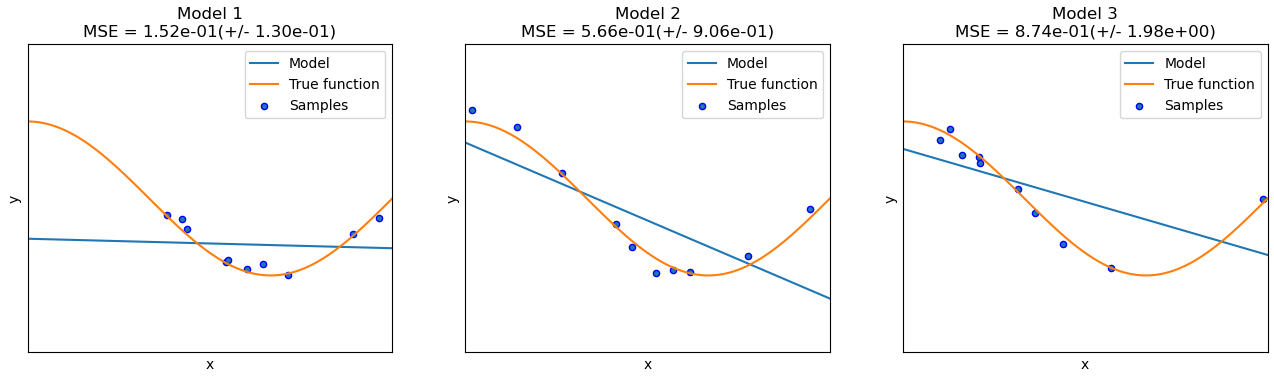
Figure 1: Regardless of the dataset sampled, a linear model exhibits high bias.
Variance
Variance is described in terms of the model fitting procedure and the training data. In terms of data, variance measures dispersion. It could also be interpreted as a measure of diversity. Sets with low variance contain samples that are close to the mean, and sampling from such a set would produce rather consistent data points.
In terms of model fitting, a model that fits the training data well but not the test data describes overfitting. This is because the training data is only an empirical sample of the true underlying distribution. A different sampling of the distribution may yield a set that more closely resembles the test set. Due to the variance of the underlying distribution, our model overfits the patterns that exist in the training set.
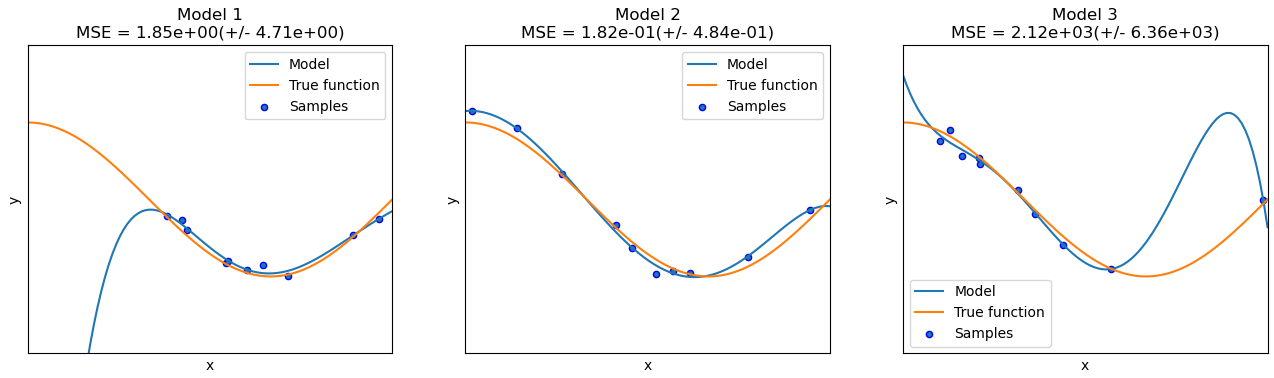
Figure 2: A 5th degree polynomial trained on 3 different samplings of the distribution.
Bias-Variance Tradeoff
If a model is not complex enough to capture the underlying distribution, it will perform poorly on both the training and test sets. Indeed, the model has low bias. If the model is too complex, it will exhibit low bias and high variance, overfitting the training set while failing to generalize well to unseen data. The solution then is to find a tradeoff between bias and variance with respect to the model complexity.