Color
Agenda
- What is color?
- How do we process color?
- How is color modeled?
- What information does color contain?
- What can we infer from color?
Light and Color
Light is electromagnetic radiation. It is generally described as waves in an electromagnetic field, but it also considered as photons. Electromagnetic radiation is typically measured based on its wavelength and intensity. Intensity refers to the amount of power that is carried by the photons.
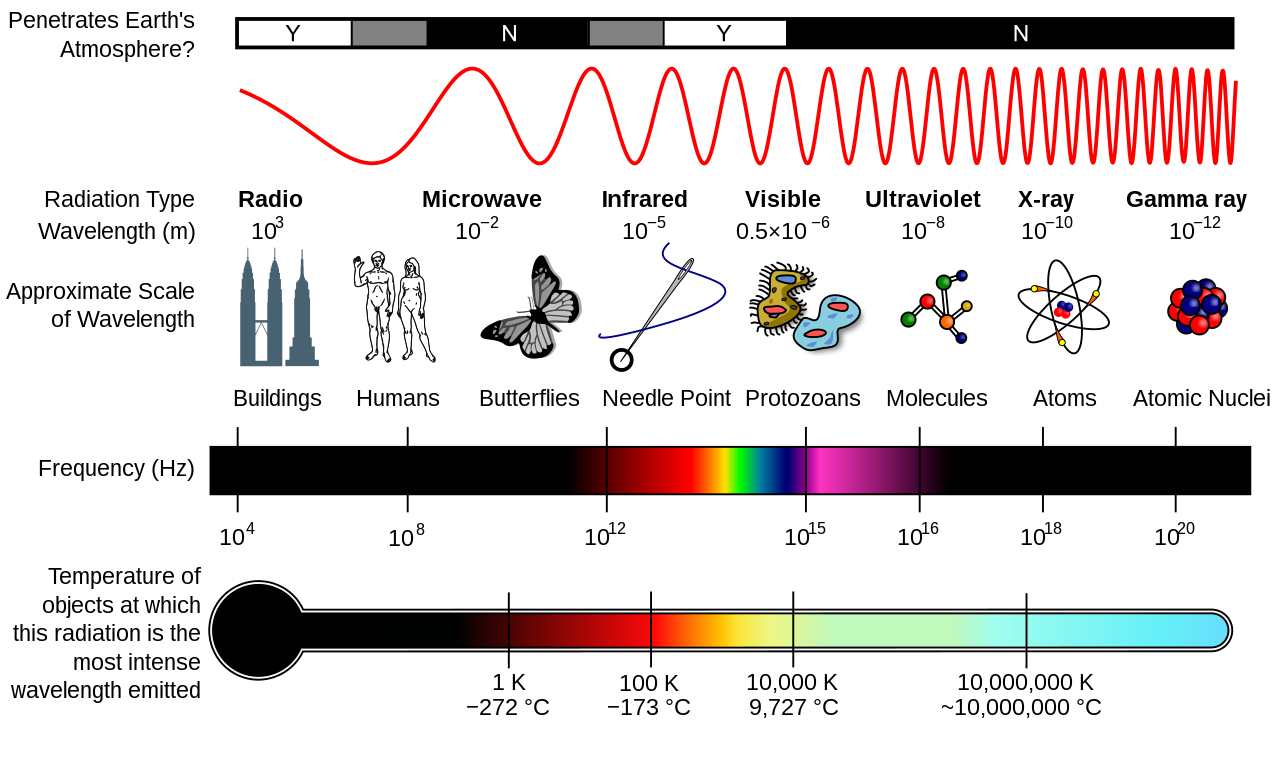
Figure 1: Electromagnetic spectrum (Wikipedia).
The visible spectrum consists of waves between 380nm and 800nm. The range of what we can see depends on several factors such as the levels of illumination. We generally associate light with color. After all, without light there is no color. However, light has no color! Light of a particular wavelength can appear as different colors depending on a myriad of factors (surroundings, shade, luminosity, etc.).
The Human Eye
The eye acts as a camera, including a lens which focuses light onto a receptive surface. The cornea covers the lens which combine to make a compound lens. The lens itself is flexible to allow the eye to focus on objects of variable distance. The lens is attached to ciliary muscles which contract or expand to change the shape of the lens. This allows us to focus on near or far objects. As we age, the lens itself becomes hardened and does not transform back to a spherical shape when the ciliary muscles contract, resulting in farsightedness.
The pupil is a diaphragm that adjusts the amount of light that enters the eye in response to varying intensities. However, this isn’t the only mechanism available for this task. Our perception of the amount of light, luminance adaptation, occurs also in the retina and brain over a longer time period (usually several minutes).
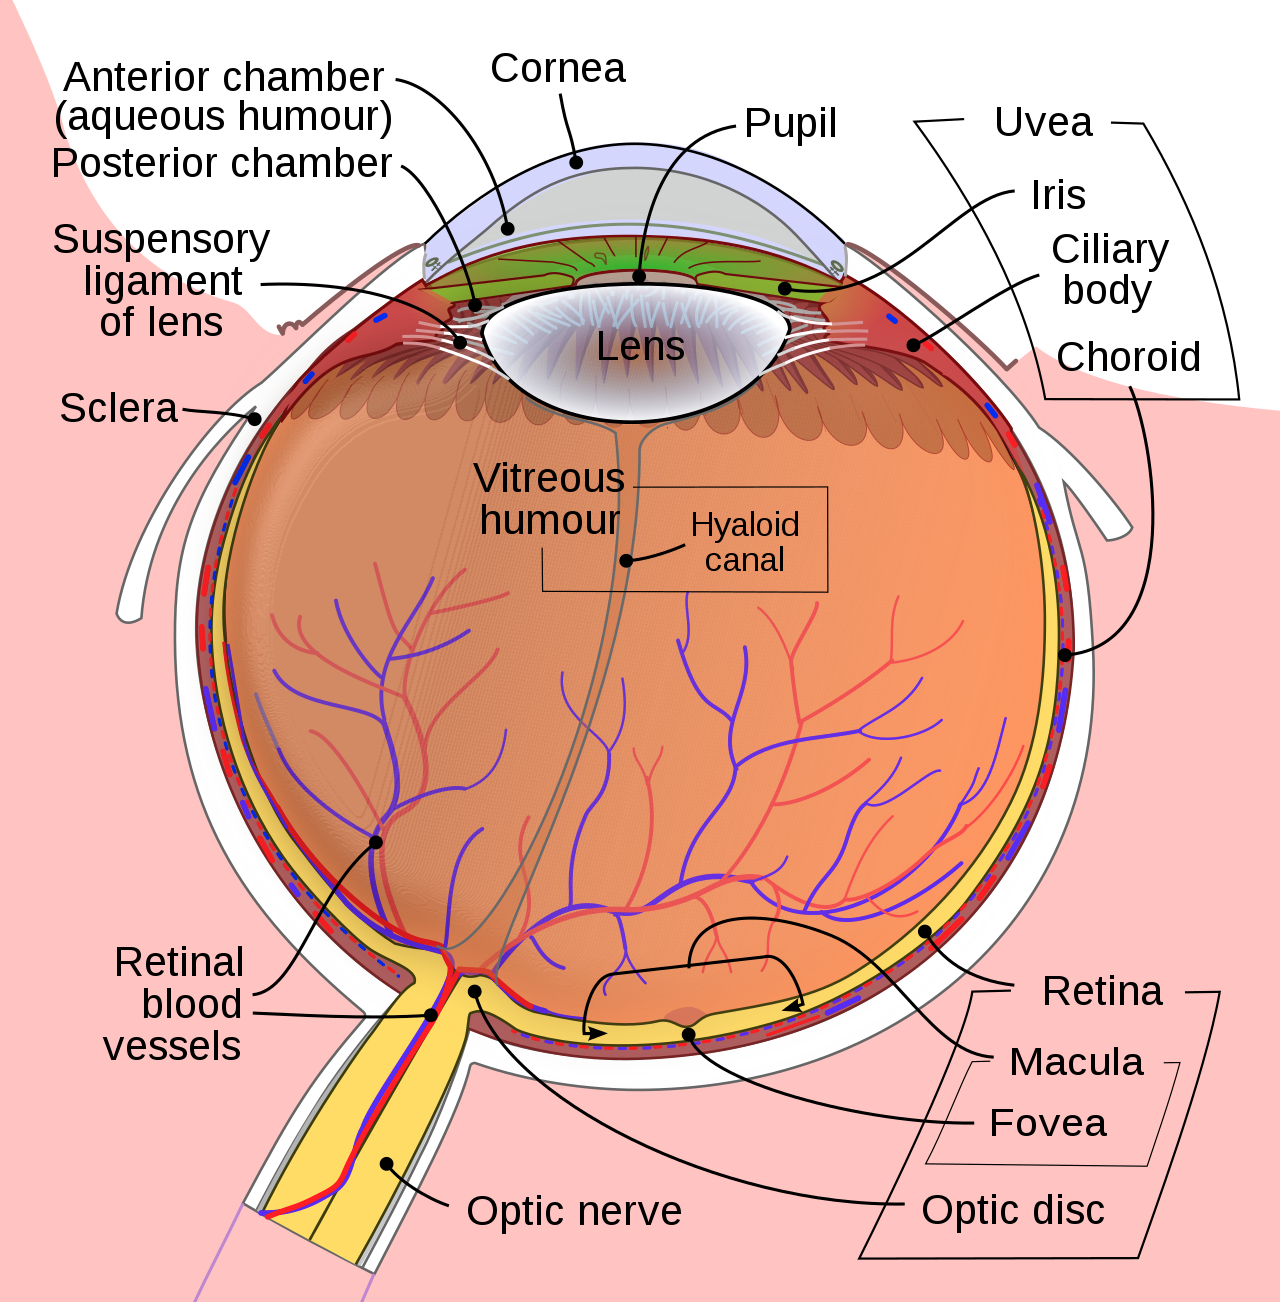
Figure 2: Source: Wikipedia
The following image from Wikipedia shows the evolution of the eye from a simple region of photoreceptors to the current model we have today.
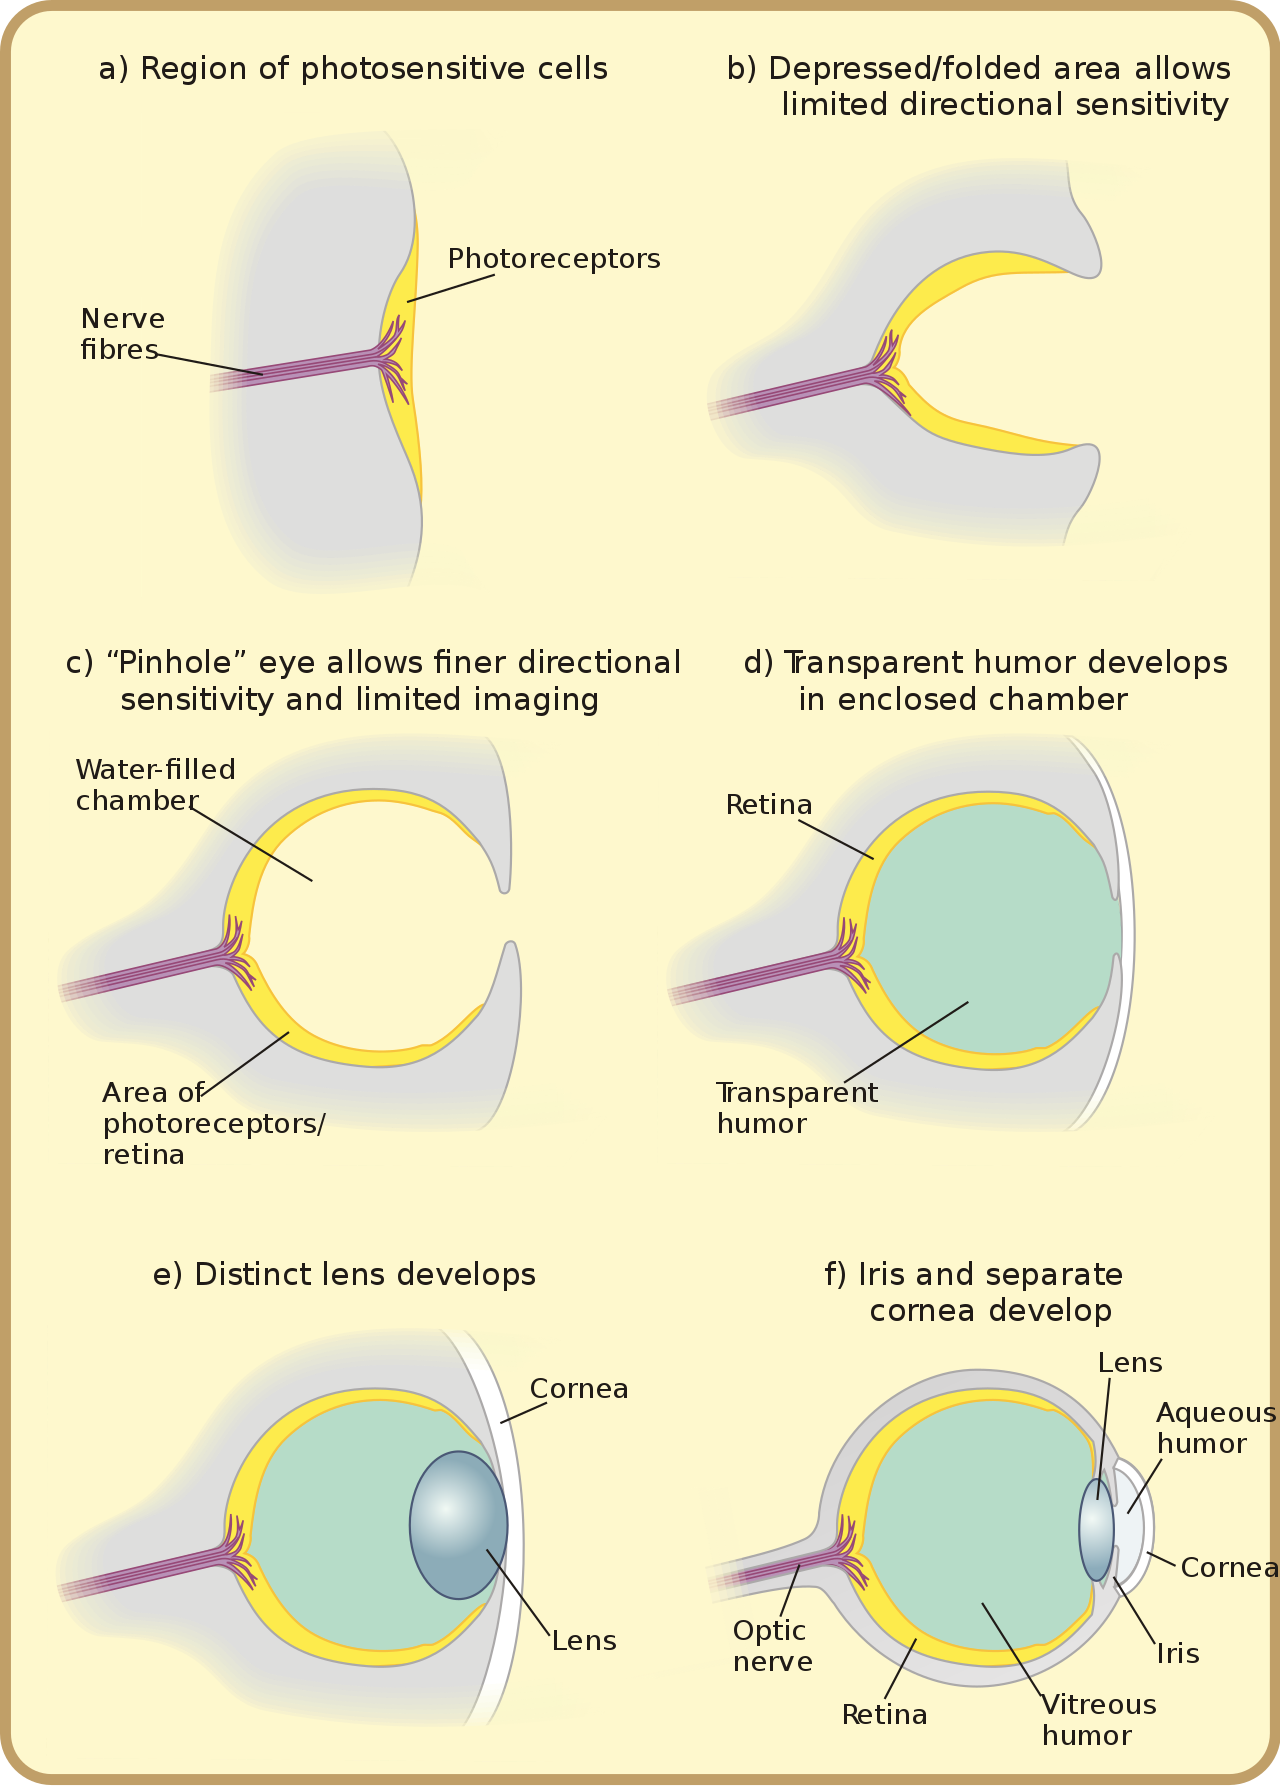
Figure 3: Source: https://en.wikipedia.org/wiki/Eye
Retina
The primary purpose of the optics of the eye is to focus light onto the retina. This is a thin layer of nerve tissue that covers the inner surface of the eye. It consists of approximately 200 million layered cells. Half are photoreceptor cells and the other half recode photoreceptor outputs before passing them on towards the brain.
Fun fact: The retina is woven with blood vessels whose purpose is to nourish the retinal tissue. These blood vessels produce the red eye effect that is seen in flash photography.
Photoreceptor Cells
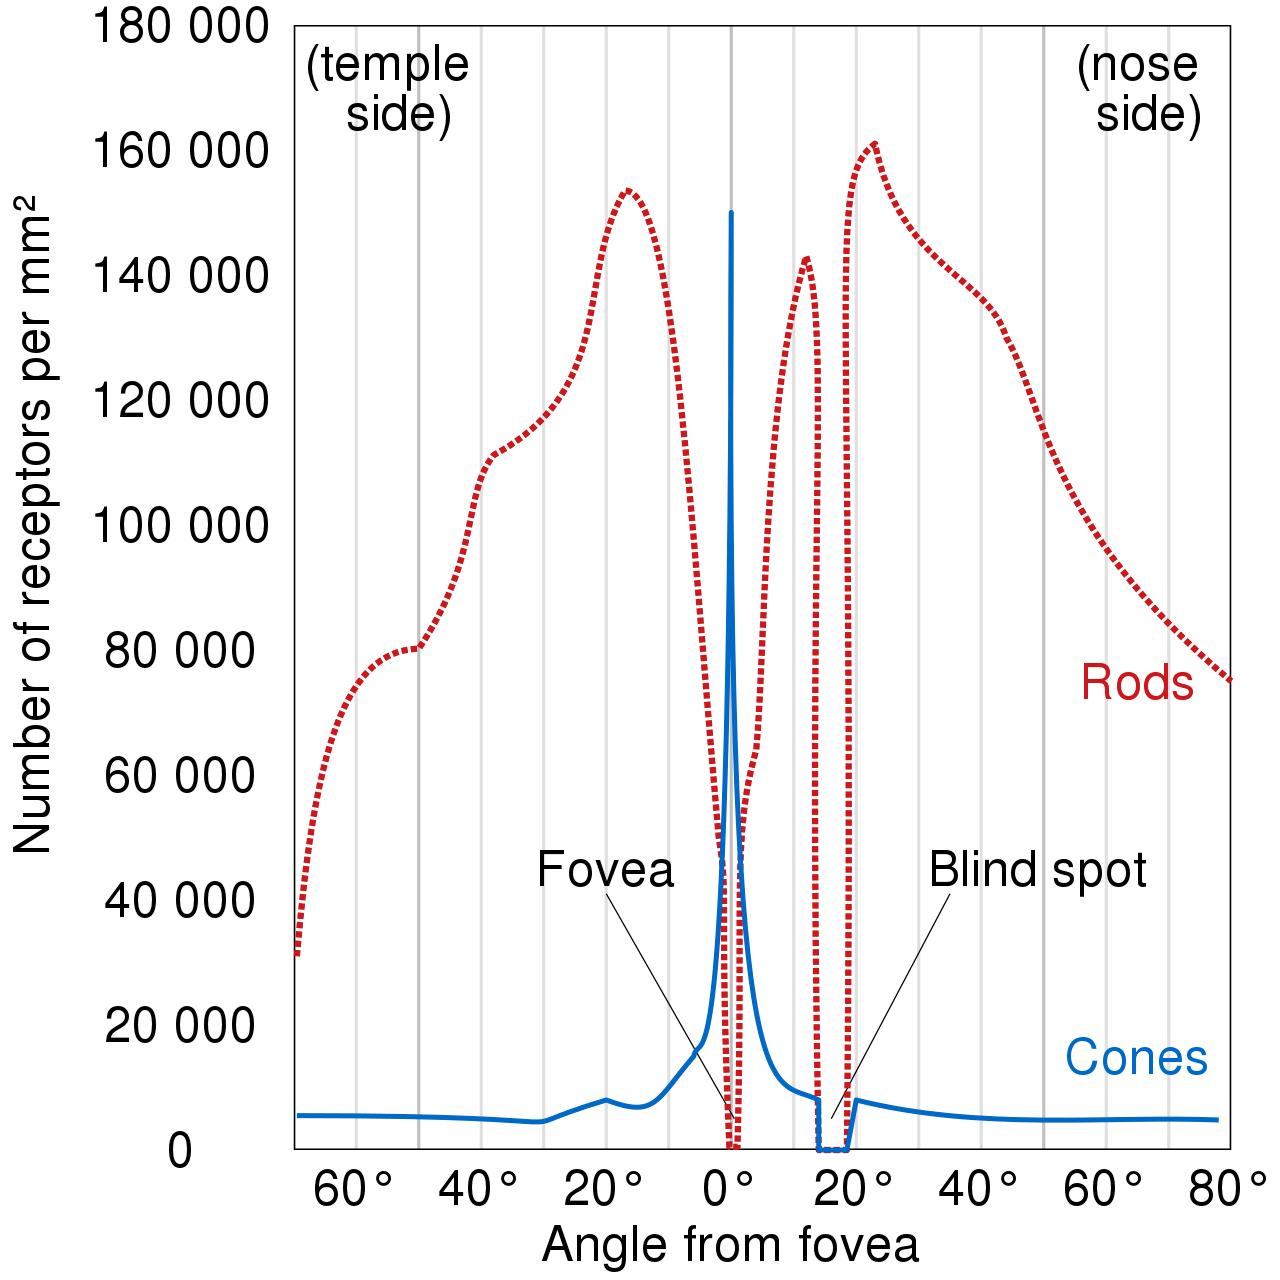
Figure 4: Distribution of rods and cones. Source: Wikipedia
Photorceptor cells can be classified into two types: rods and cones. There are about 100 million rods and 6 million cones. Rods dominate our low-light vision. They do not have the variety of photopigments necessary for color vision. Cones dominate our color vision. They can be separated into one of three classes of light receptors. These three classes contain a specific type of photopigment that is sensitive to different wavelengths of light.
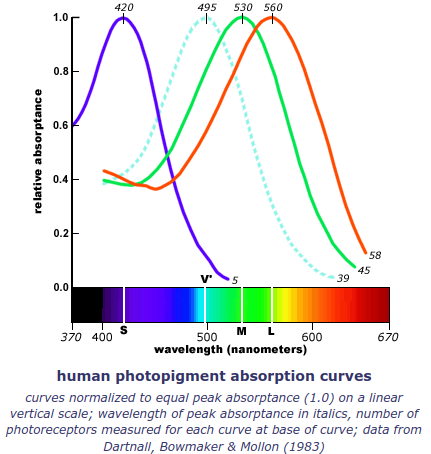
Figure 5: Source: https://handprint.com/HP/WCL/color1.html#3cones
Rods can pool input together before sending it to the brain. Low-light perception is better through peripheral vision.
Most of the cones are in the fovea. The high density of cones in this region means that the resolution is highest. Microsaccades - The eye is making tiny movements so that the eye is never fixated on a single point. This allows light to hit a greater number of photoreceptors.
The other segment of a photoreceptor cell lies the photopigment molecules. These act as transducers which convert light energy into a biological response. These molecules are made up of a light sensitive molecule called chromophore and a protein called opsin. Together, they are usually referred to as rhodopsin.
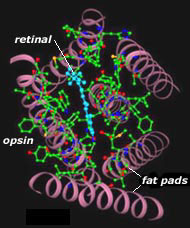
Figure 6: Photopigment Molecules. Source: https://handprint.com/HP/WCL/color1.html
Types of Photopigments
Each photoreceptor can respond to light differently depending on the specific type of rhodopsin it is made up of.
The response of each type of cone has been measured and can is separated into short wavelength (S), medium wavelength (M), and long wavelength (L). Some resources incorrectly label these as B, G, and R receptors. This is not entirely accurate as there is much overlap between the medium and long wavelength receptors.
Mathematical Model
How would we model a photoreceptor, mathematically? The response is dependent on how sensitive the receptor is to a specific wavelength along with the light arriving at the receptor.
\begin{equation*} p_k = \int_{\Lambda} \sigma_k(\lambda)E(\lambda)d\lambda \end{equation*}
Color Matching
WATCH: Color Vision 2: Color Matching
The theory that the visible colors are visible from the three primaries is called trichomatic theory. Trichromacy has been measured and observed.
How is it known that these 3 (or 4) types of photoreceptors absorb a specific wavelength? In other words, how do we know that color vision break down? There has not been a way to measure cone responses in living humans, but there is a way to measure them indirectly.
James Clerk Maxwell’s color matching experiments aim to do exactly that. In this experiment, participants are given a test color and a matching color. The goal is to add some amount of primary colors until the matching color is the same as the test color. There are some saturated test colors that cannot be matched in an additive manner (combining primaries). In these cases, the subjects are allowed to subtract some amount of a primary color from the test color until it matches the matching color.
Over many different experiments involving many subjects, it was found that most subjects will match the test color with the same amount of primary weights. This provided confirmation that human vision is trichromatic. There were also carefully screen dichromats who lacked one class of photoreceptor.
Is color matching reliable? Do we see all wavelengths the same? That is, do we have an equal number of photoreceptors for each range?
The fact that many independent observers came up with similar distributions of primary colors to match test colors gave rise to Grassman’s laws.
The result of these experiments reveals a function of cone sensitivities. Cones are unequally distributed across the retina. Visual angle and whether the light is detected in the central vs. peripheral region matters. The CIE 1931 RGB color matching functions show how much of each primary wavelength is required to match a particular target wavelength. The negative values mean that the primary was added to the test color in order to match.
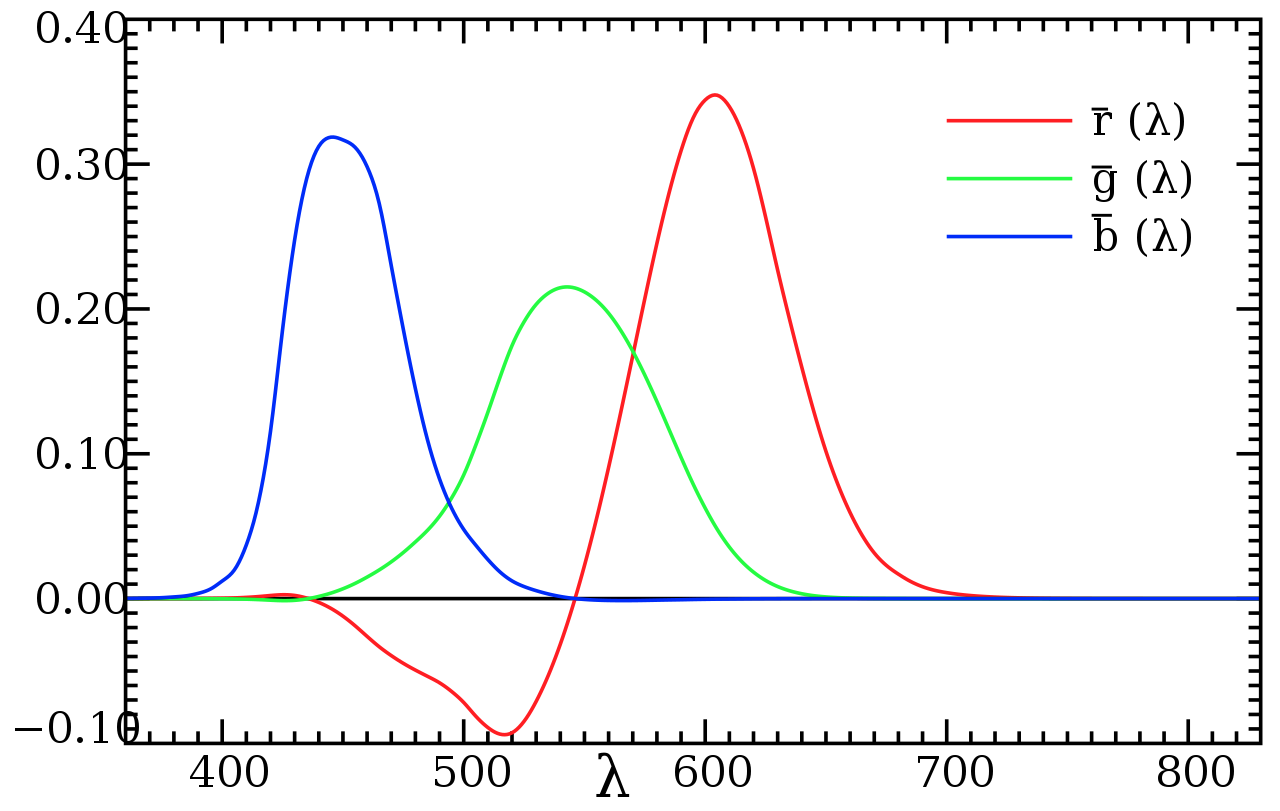 Source: https://en.wikipedia.org/wiki/CIE_1931_color_space
Actual cone sensitivy depends on light sensitivy. One of the most popular graphs of cone response is from Stockman & Sharpe (2000):
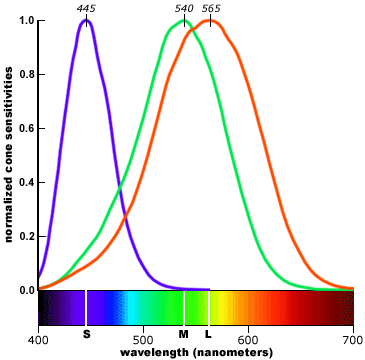
This graph is normalized to peak response and is not representative of the distribution of cones in the retina. If we weight the responses by the proportion of each class of cone in the retina, the graph looks like:
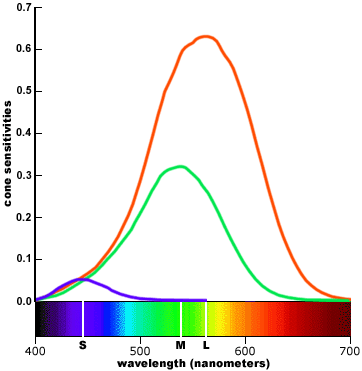
The fact that the 3 shapes are colored as blue, green, and red are misleading. There are far more photoreceptors that perceive green light than there are blue or red light. You can see this when comparing green text versus blue text. Reading the blue text may strain your eyes and appear blurry. This is because there are simply fewer receptors available for these wavelengths. Fewer such receptors also implies that the resolution is smaller.
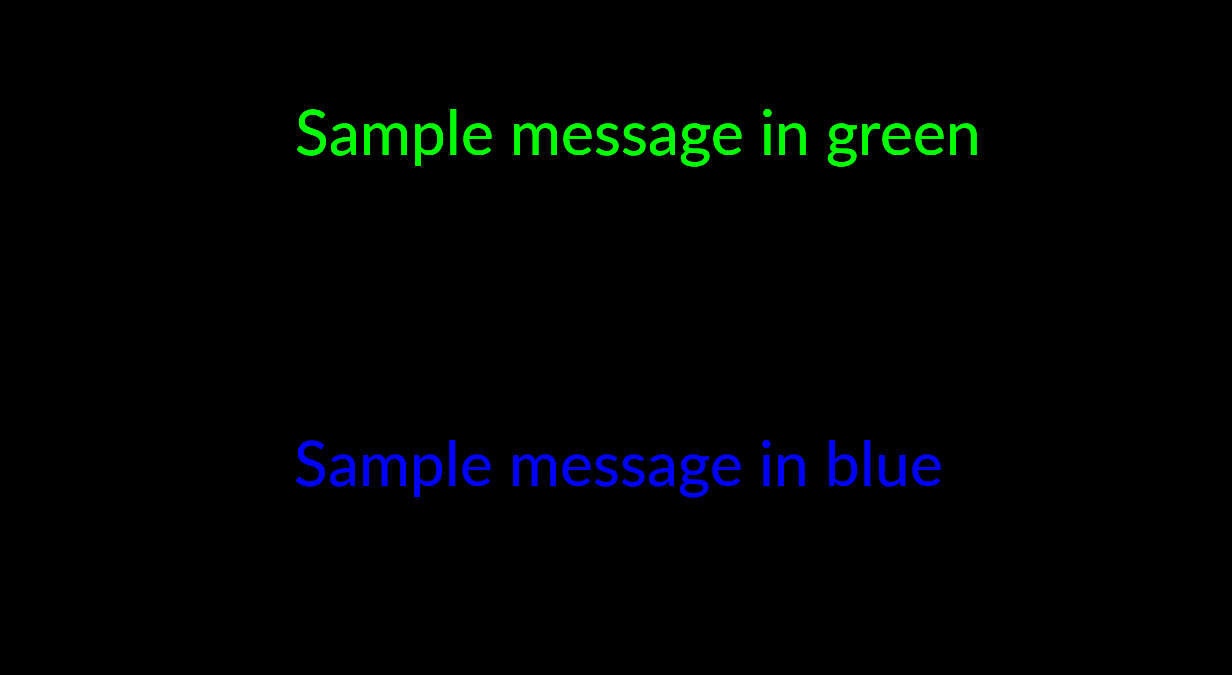
Figure 7: Fewer blue cones results in blue light appearing more blurry.
Color Physics
Light sources themselves can produce different colors at different wavelengths. The sky varies in color depending on the relative location of the sun. A surface is dependent on the color of the surface itself as well as the incident light shining towards it. A white surface with a green light shining on it will reflect green light. A green surface with white light will also reflect green. Further complexities such as atmosphere and dust can further complicate this.
In our world, both the sky and the sun are important light sources. They are often referred to as skylight and sunlight, respectively. Imagine a clear day with the sun at the highest point in the sky. The sun is seen as a yellow object with the surrounding sky being a rich blue. Compared to the zenith of the sky, the horizon is typically brighter. This is because air scatters the incident light. This can be modeled by assuming the sky emits a constant amount of exitant light per volume.
Why does the sun appear yellow and the sky appear blue? Longer wavelengths can travel farther before being scattered. This means that a ray of light travelling from the sun to the earth will scatter blue light before the other rays. Taking the blue light out of a ray of white light will leave a yellowish color. When the scattered blue light eventually hits the atmosphere of Earth, it is scattered once again and see as incident light to an observer. This gives the apperance of a blue sky.
The perceived color of an object can be computed by multiplying the incident illumination with the reflectance of the object.
Color Temperature
Color temperature is a measure of the color characteristics of light. It is measured in degrees Kelving (K) and is based on the color of light emitted by an idealized black body radiator at a given temperature. A black body absorbs all incident electromagnetic radiation and emits the maximum possible amount of radiation at every wavelength for a given temperature.
As a black body is heated, it emits light that changes color depending on its temperature. At lower temperatures, the color is a red. As it increases, the color becomes whiter until reaching a light blue. See the table below:
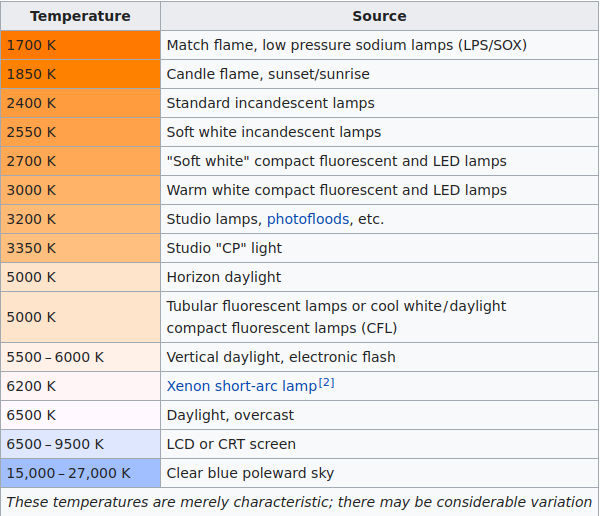
Figure 8: Colors corresponding to different temperatures. Source: Wikipedia
Color Spaces
How is color represented based on color matching? Can we accurately reproduce any color digitally?
https://www.wnycstudios.org/podcasts/radiolab/episodes/211119-colors Interesting podcast on Color.
There are several color spaces (or color models) available. The most common is RGB. In this section, we will explore the most common color spaces.
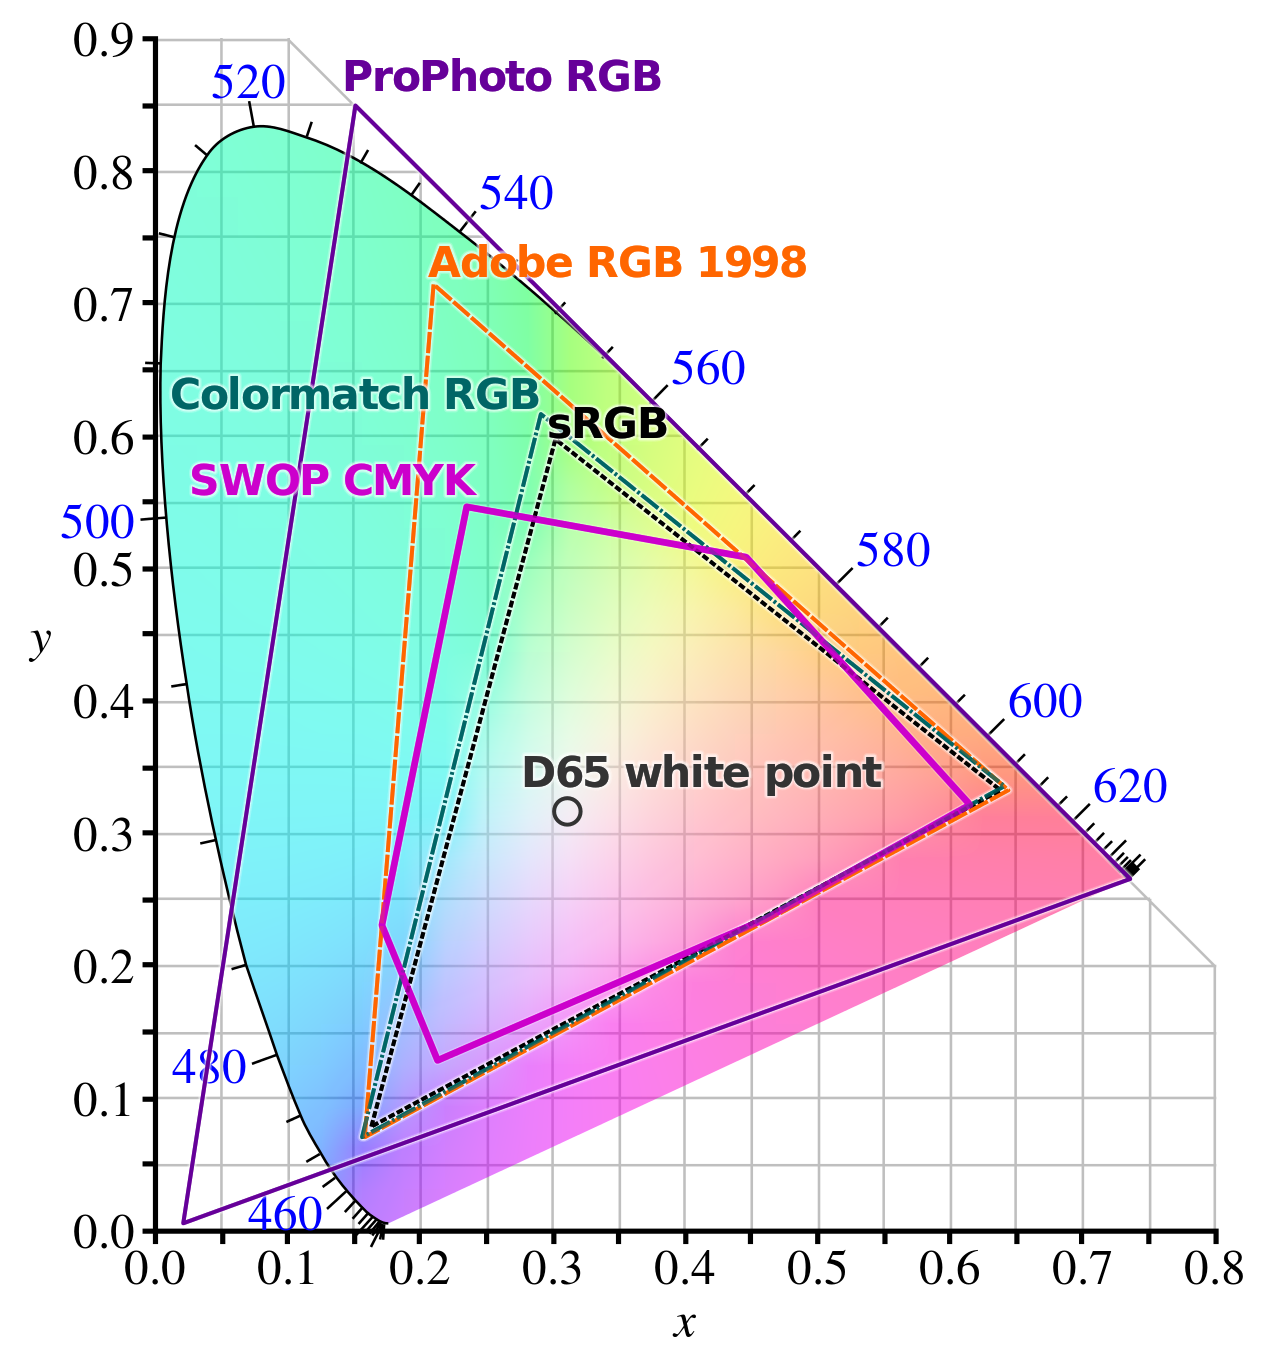
Figure 9: Comparison of several common color spaces. Source: https://en.wikipedia.org/wiki/ProPhoto_RGB_color_space
CIE xy Color Space
Verifying trichomatic theory meant that one should attempt to reproduce monochromatic (single wavelength) colors as a weighted mixture of primary colors. The Commision Internationale d’Eclairage did just that in the 1930s. They performed their own color matching experiments using red, blue, and green wavelengths as primary colors. Another benefit of this process is to set a standard in which colors can be reproduced.
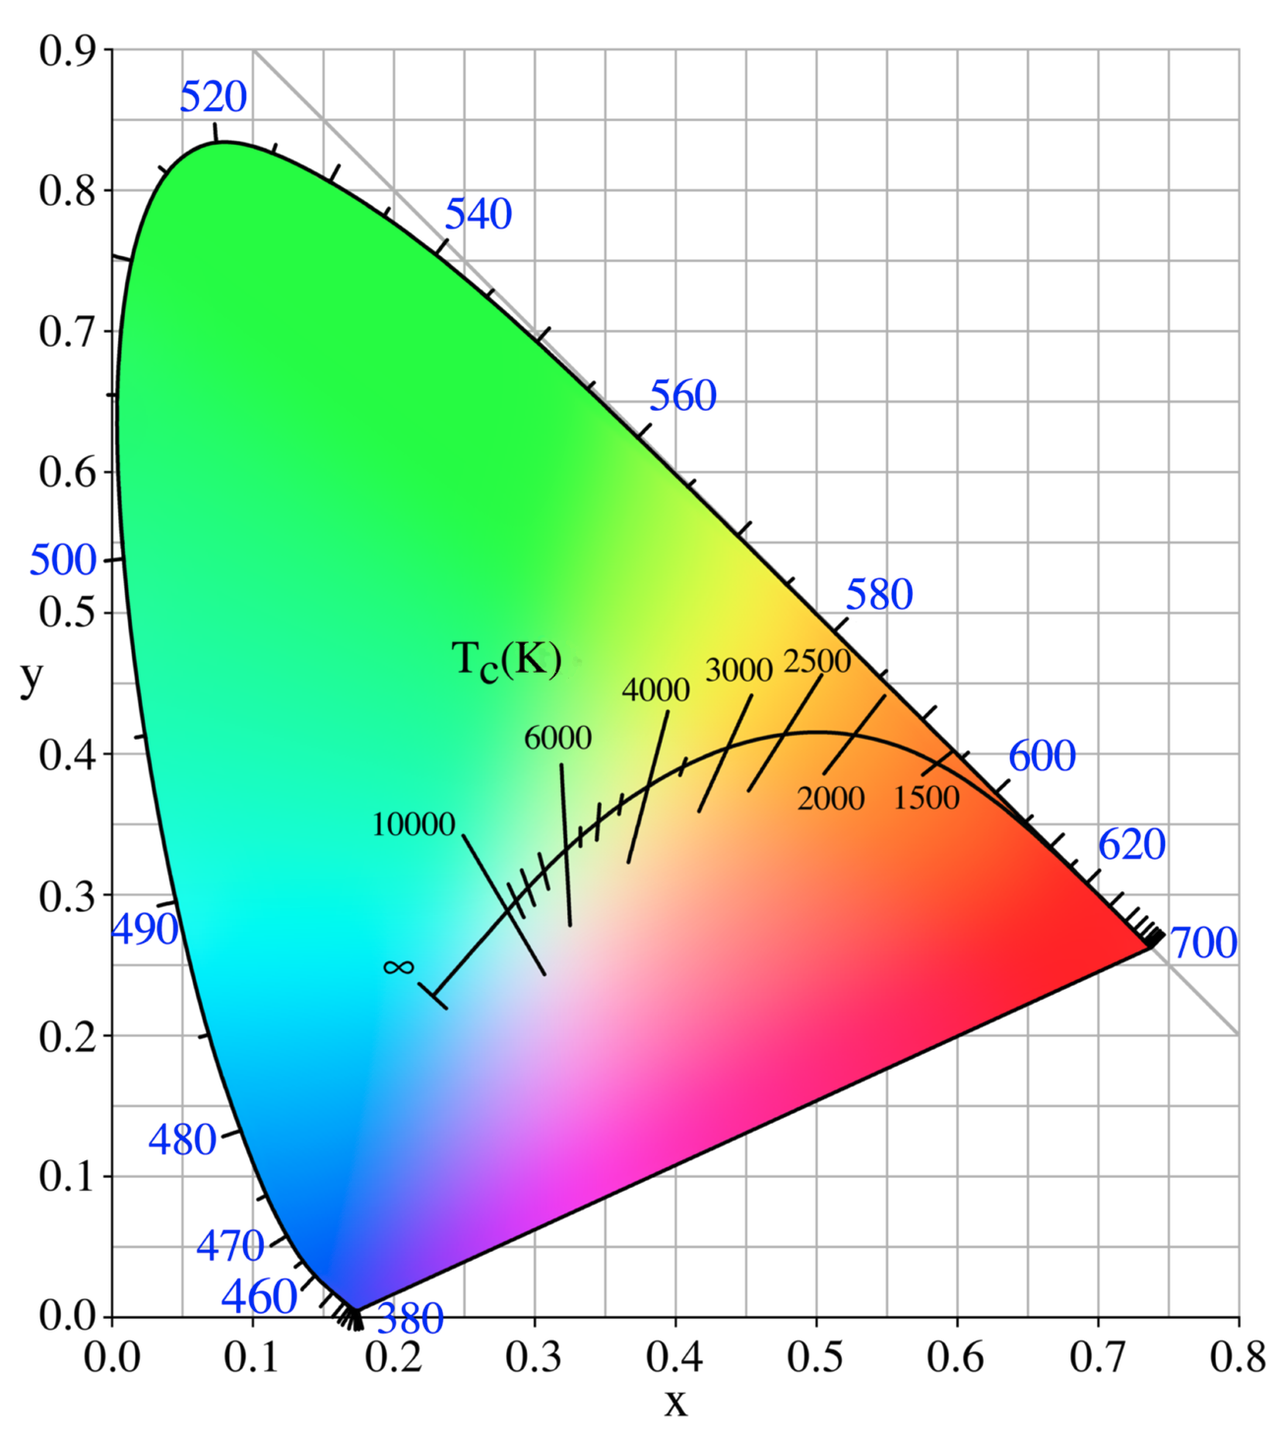
Figure 10: CIE xy color space.
This shows the CIE xy space which was taken from CIE XYZ space. This 2D space is an intersection of the original XYZ space by the plane \(X + Y + Z = 1\). The coordinates are then
\begin{equation*} (x, y) = \Big(\frac{x}{x + y + z}, \frac{y}{x + y + z}\Big). \end{equation*}
The border of this shape represents the wavevelength of the pure color. The colors in the middle represent some linear combination of those wavelengths.
RGB Color Spaces
RGB color spaces are the most commonly used in computer graphics. CIE also has their own RGB color space. It is derived from color matching experiments using 3 monochromatic primary colors.
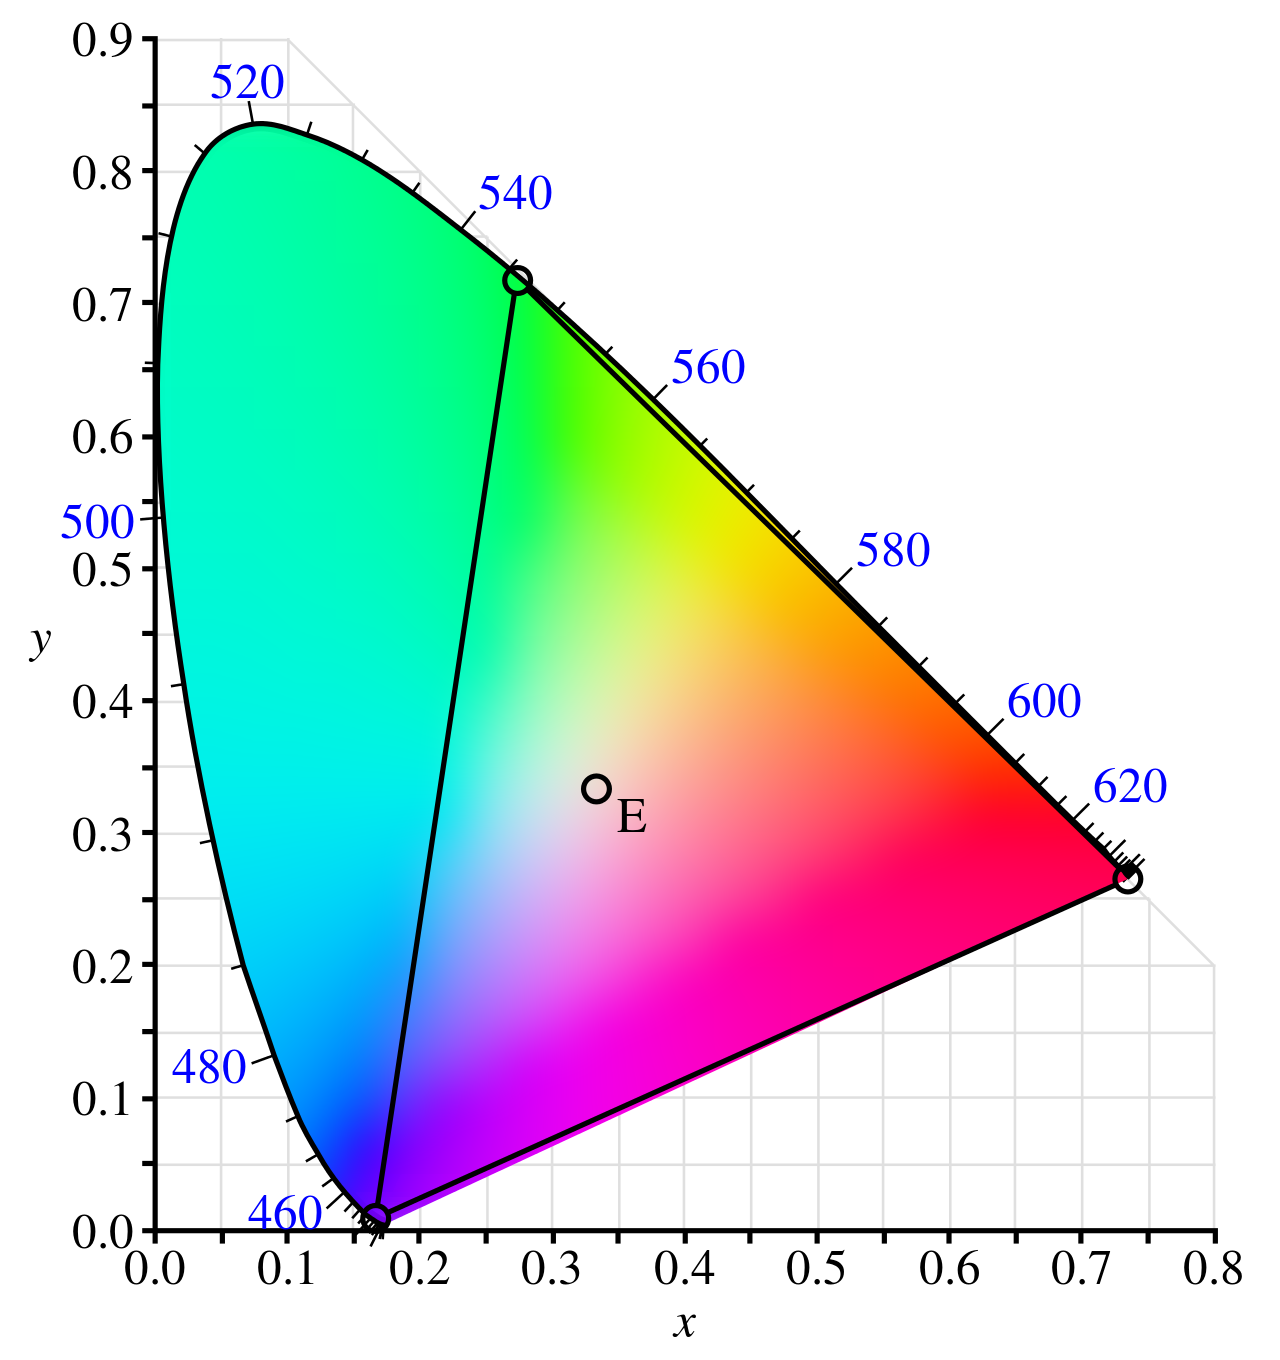
Figure 11: CIE RGB gamut on the CIE xy color space.
RGB models are commonly represented as a cube, as seen in the figure below.
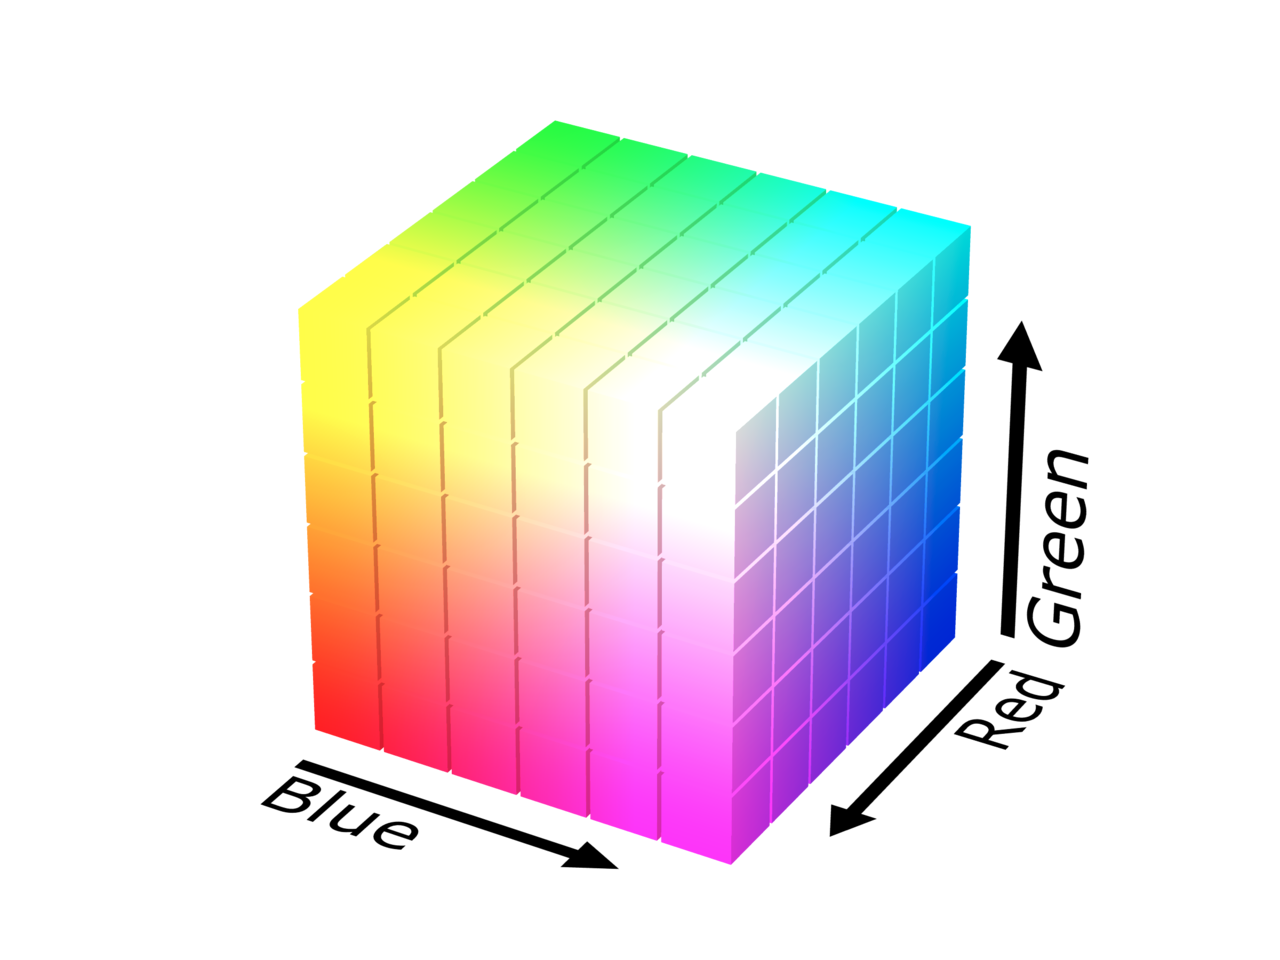
Figure 12: Cube representation of an RGB color space.
HSV Color Space
Hue, Saturation, Value (HSV) provides an alternative representation of RGB. Hue represents the color. Given a fixed value for saturation and value, colors in HSV should appear as if they are receiving the same level of light.
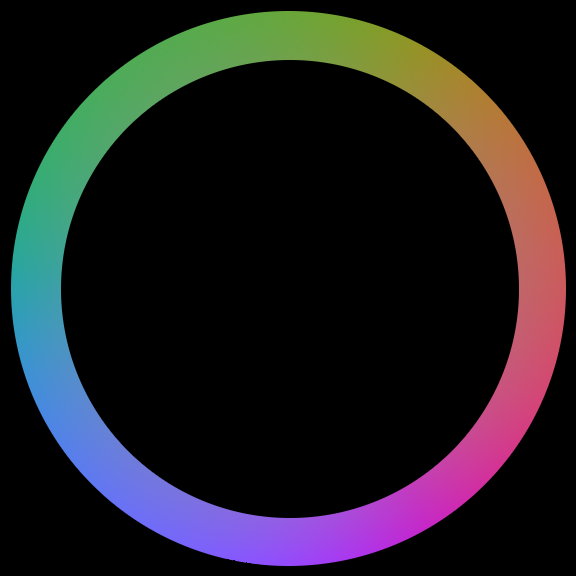
Figure 13: Hue values when saturation and value are fixed. Source: Wikipedia
The CIE defines saturation as “the colourfulness of an area judged in proportion to its brightness.” The value of a pixel represents how bright the color is compared to black.
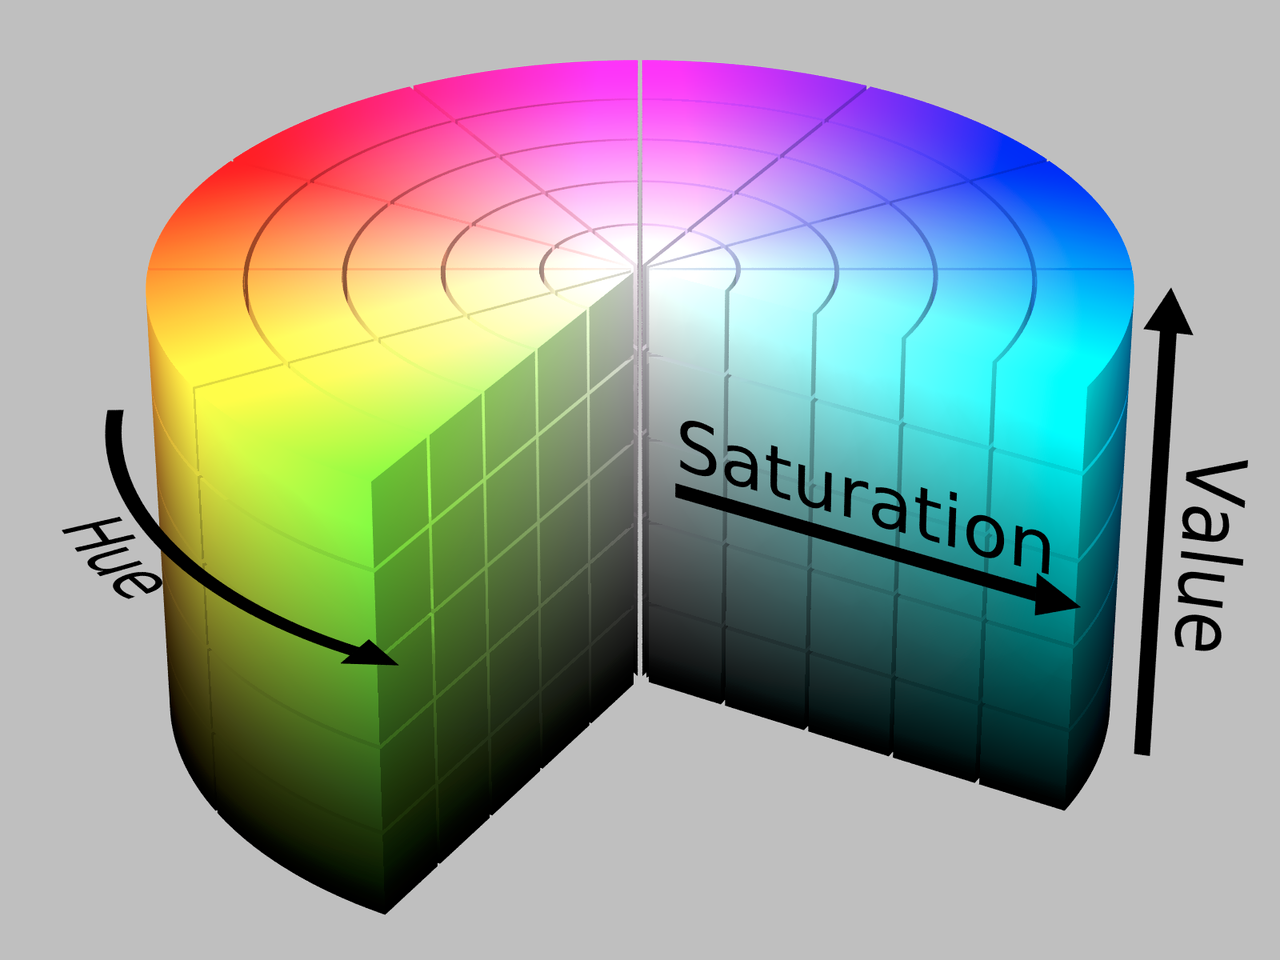
Figure 14: HSV cylinder exemplifies the concepts of hue, saturation, and value. Source: Wikipedia
Conversion from RGB
We can convert images to HSV from RGB and vice versa. This article will only go through the steps of actually transforming it. To gain a better understanding of the conversion between HSV to RGB, check out the Wikipedia page.
We start by making sure that are input image is normalized such that the RGB values are in the range \([0, 1]\). If that’s the case, we can calculate the HSV value \(V\) as
\[ V = \max(R, G, B). \]
We can do this in one command in Python using numpy:
V = np.max(img, axis=2)
Saturation is computed based on another quantity called Chroma. It is simply computed as
\[ C = V - \min(R,G,B). \]
In Python, this is simply
C = V - np.min(img, axis=2)
Saturation is then computed as \(S = \frac{C}{V}\). Note that this will be undefined if \(V = 0\). In practice, we can set \(S = 0\) if \(V\) is also 0.
Hue is commonly measured in degrees between \([0, 360]\). As seen in the figure below, it is the angle past the previous edge of the hexagon.
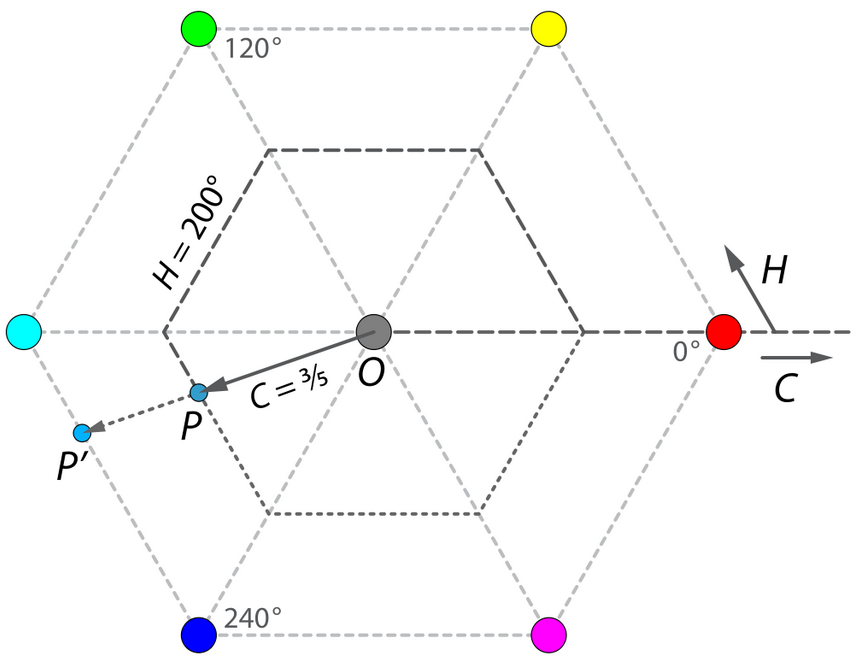
Figure 15: Hue is the angle of the projected point with respect to the hexagon. 0 degrees is marked by the red edge. Source: Wikipedia
The function for Hue can be written as a piecewise function, altered slightly to account for undefined values in practice:
\begin{equation*} H’ = \begin{cases} 0, & C = 0\\ \frac{G - B}{C} \text{ mod } 6, & \text{if } V = R\\ \frac{B - R}{C} + 2, & \text{if } V = G\\ \frac{R - G}{C} + 4, & \text{if } V = B\\ \end{cases} \end{equation*}
Then, \(H = 60^{\circ} \times H’\).
Conversion to RGB
To go back to RGB, we take an HSV image with \(H \in [0^{\circ}, 360^{\circ}]\), and \(S, V \in [0, 1]\). The Chrome value is calcuated as
\[ C = V \times S. \]
We then divide up the Hue into one of 6 values:
\[ H’ = \frac{H}{60^{\circ}}. \]
With these intermediate value, we can calculate the corresponding point within the RGB cube that has the same hue and chroma as the current pixel value, with \(X\) being the second largest component of the color:
\[ X = C \times (1 - |H’ \text{ mod } 2 - 1|) \]
and then
\begin{equation*} (R’, G’, B’) = \begin{cases} (C, X, 0) & \text{if } 0 \leq H’ < 1\\ (X, C, 0) & \text{if } 1 \leq H’ < 2\\ (0, C, X) & \text{if } 2 \leq H’ < 3\\ (0, X, C) & \text{if } 3 \leq H’ < 4\\ (X, 0, C) & \text{if } 4 \leq H’ < 5\\ (C, 0, X) & \text{if } 5 \leq H’ < 6\\ \end{cases} \end{equation*}
The final RGB value can be calculated by adding the difference between the value and chroma to each pixel:
\[ m = V - C \]
\[ (R, G, B) = (R’ + m, G’ + m, B’ + m). \]
Some Examples
Given an original image (below), we’ll view the output of changing the Hue, Saturation, and Value.

Figure 16: Original image. Credit: The Expanse
Reducing the Hue by 20 produces the following image:
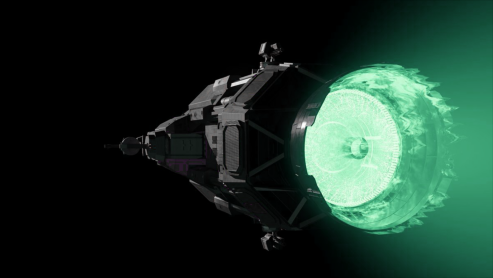
Figure 17: Image with Hue subtracted by 20 degrees. Credit: The Expanse
Given our working knowledge of how hue is computed, this makes sense. The previous angle clearly pointed to lighter blue colors, reducing that by \(20^{\circ}\) moves us towards the green edge.
Now let’s take the original image and increase saturation by 0.3:

Figure 18: Image with Saturation increased by 0.3. Credit: The Expanse
All colors across the board look “richer” and “deeper”. This corresponds with the definition of the HSV cylinder.
Finally, we’ll view an image in which the value was modified. Let’s increase the values by 0.2:

Figure 19: Image with Values increased by 0.2. Credit: The Expanse
This looks washed out. All of the pixels with 0 values were increased uniformly. Perhaps we could clamp that by setting all pixels with the given value change back to their original values.