Profiling CUDA Applications
Overview of Nsight
NVIDIA NSight Compute is a profiling tool for CUDA kernels. It features an expert system that can help you identify performance bottlenecks in your code. It is essential for methodically optimizing your code. These notes will cover the basics of using Nsight Compute to profile your CUDA applications.
Getting Started with Nsight
Profiling our first program
In Lab 0, you implemented a vector addition kernel that is embarrassingly parallel. We will now use Nsight to profile its performance. Realistically, there is not much we can do to increase the performance of this kernel, but it will still help us understand the information that Nsight gives. To profile the application, simply launch ncu with your application.
ncu ./build/main
Depending on where you are running this program, it may be necessary to launch it with sudo. If everything was successful, it will output something similar to the following:
Nsight Output
vec_add(float *, float *, float *, int), 2024-Jan-16 10:42:52, Context 1, Stream 7
  Section: GPU Speed Of Light Throughput
  ---------------------------------------------------------------------- --------------- ------------------------------
  DRAM Frequency                                                           cycle/nsecond                           5.71
  SM Frequency                                                             cycle/nsecond                           1.15
  Elapsed Cycles                                                                   cycle                          3,279
  Memory [%]                                                                           %                           7.54
  DRAM Throughput                                                                      %                           7.54
  Duration                                                                       usecond                           2.85
  L1/TEX Cache Throughput                                                              %                           4.32
  L2 Cache Throughput                                                                  %                           4.86
  SM Active Cycles                                                                 cycle                         623.58
  Compute (SM) [%]                                                                     %                           0.82
  ---------------------------------------------------------------------- --------------- ------------------------------
  WRN   This kernel grid is too small to fill the available resources on this device, resulting in only 0.1 full
        waves across all SMs. Look at Launch Statistics for more details.

  Section: Launch Statistics
  ---------------------------------------------------------------------- --------------- ------------------------------
  Block Size                                                                                                        256
  Function Cache Configuration                                                                  cudaFuncCachePreferNone
  Grid Size                                                                                                          16
  Registers Per Thread                                                   register/thread                             16
  Shared Memory Configuration Size                                                 Kbyte                           8.19
  Driver Shared Memory Per Block                                             Kbyte/block                           1.02
  Dynamic Shared Memory Per Block                                             byte/block                              0
  Static Shared Memory Per Block                                              byte/block                              0
  Threads                                                                         thread                          4,096
  Waves Per SM                                                                                                     0.07
  ---------------------------------------------------------------------- --------------- ------------------------------
  WRN   The grid for this launch is configured to execute only 16 blocks, which is less than the GPU's 38
        multiprocessors. This can underutilize some multiprocessors. If you do not intend to execute this kernel
        concurrently with other workloads, consider reducing the block size to have at least one block per
        multiprocessor or increase the size of the grid to fully utilize the available hardware resources. See the
        Hardware Model (https://docs.nvidia.com/nsight-compute/ProfilingGuide/index.html#metrics-hw-model)
        description for more details on launch configurations.

  Section: Occupancy
  ---------------------------------------------------------------------- --------------- ------------------------------
  Block Limit SM                                                                   block                             16
  Block Limit Registers                                                            block                             16
  Block Limit Shared Mem                                                           block                            100
  Block Limit Warps                                                                block                              6
  Theoretical Active Warps per SM                                                   warp                             48
  Theoretical Occupancy                                                                %                            100
  Achieved Occupancy                                                                   %                          15.85
  Achieved Active Warps Per SM                                                      warp                           7.61
  ---------------------------------------------------------------------- --------------- ------------------------------
  WRN   This kernel's theoretical occupancy is not impacted by any block limit. The difference between calculated
        theoretical (100.0%) and measured achieved occupancy (15.9%) can be the result of warp scheduling overheads
        or workload imbalances during the kernel execution. Load imbalances can occur between warps within a block
        as well as across blocks of the same kernel. See the CUDA Best Practices Guide
        (https://docs.nvidia.com/cuda/cuda-c-best-practices-guide/index.html#occupancy) for more details on
        optimizing occupancy.
Viewing Results in the GUI
Nsight comes with both CLI and GUI clients. It is recommended to parse the information from the GUI. The GUI can launch programs both locally and remotely. It can also display the result of a previous launch. To generate a profiling report for our vector addition kernel, run the following command:
ncu -o vec_add_profile ./build/main
The argument after -o is the name of the output file. Open Nsight Compute and load the saved file. It should look something like this.
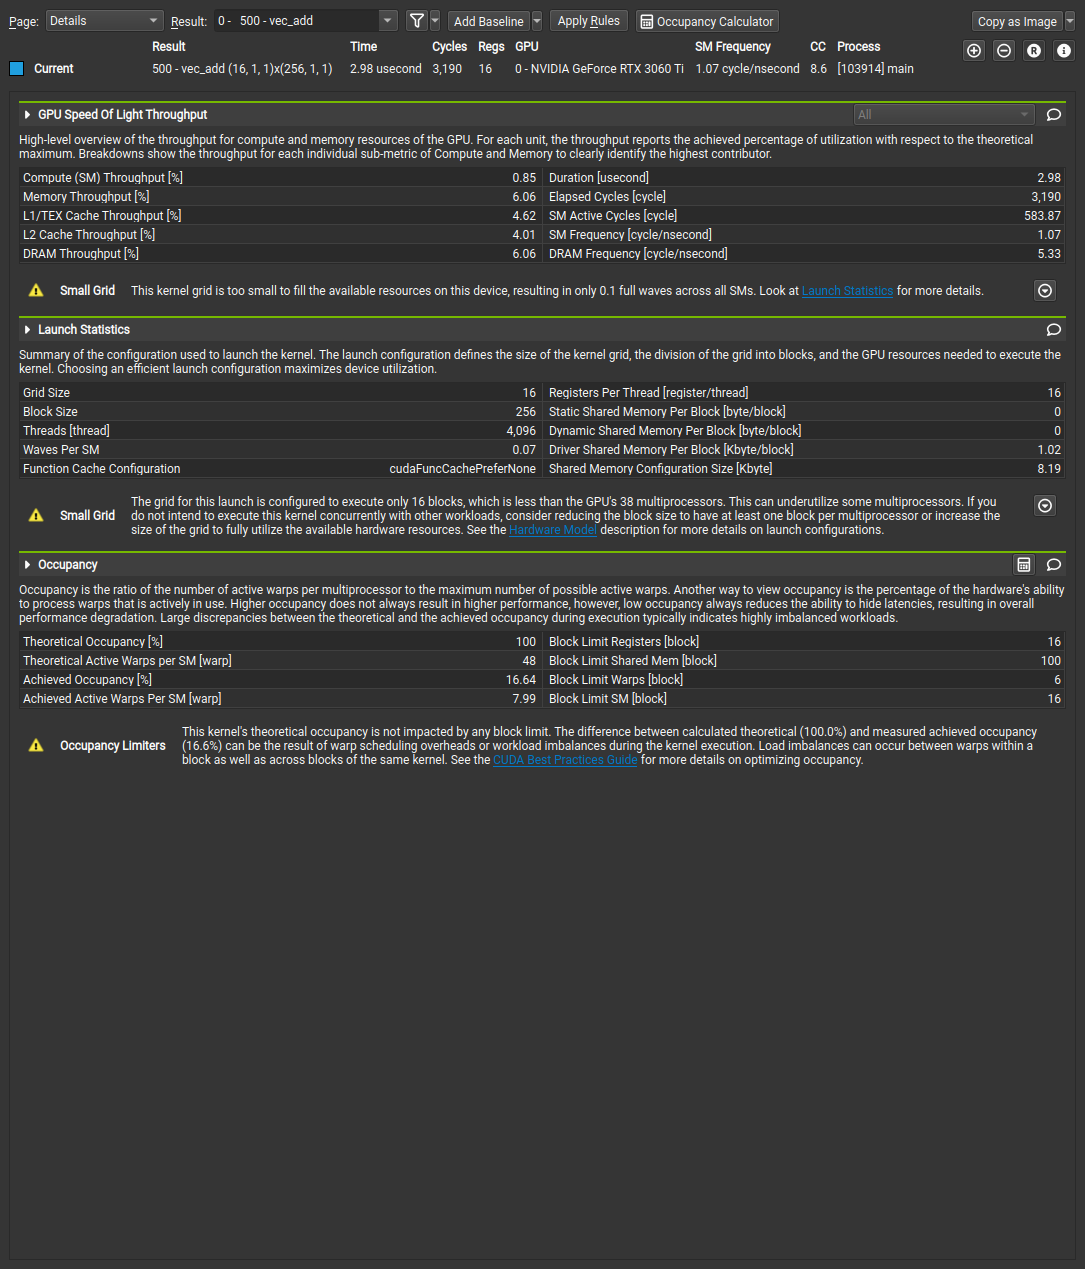
Figure 1: Nsight Compute GUI output
This basic report only includes three sections: GPU Speed of Light, Launch Statistics, and Occupancy Analysis. We will go over each of these sections in detail.
GPU Speed of Light
This section displays high level aspects of your kernel. The main metrics report what your application is doing relative to peak performance. Sparing the full details of the documentation, the most important metrics are:
- Duration: The total time spent executing the kernel. This is the most important metric for performance.
- SM
[%]: The relative throughput of the SMs as compared to the theoretical maximum. - Memory
[%]: The relative throughput of the memory as compared to the theoretical maximum.
Do not get lost in the numbers!
Remember that this tool is simply reporting facts about your kernel. Take care not to misinterpret the data. In the run from above, the kernel throughput is only 0.85%. There are a number of reasons as to why this number is so low.
- Latency Issues: The kernel may have to wait for memory operations, resulting in a low throughput.
- Workload Characteristics: Your particular kernel may not need to do much work, resulting in a low throughput.
Launch Statistics
This section shows us the launch configuration that was used for this kernel. In our earlier programs, we may set these manually for testing. Later on, we will want our programs to adapt to changing input sizes, so these statistics will becomes more useful.
More importantly, this shows you the resource usage per block.
If you are profiling an application for which you are not familiar with the code, it is convenient to know the grid and block sizes that were used when launching the kernel.
Occupancy Analysis
Memory Workload Analysis
Case Study: Matrix Multiplication
Tips and Best Practices
- Do not confuse high throughput for high performance. Throughput is a measure of how much work is being done, not how fast it is being done.
- Using a larger grid size is not always better. More grids introduce more overhead and can lead to lower performance.
OCL Notes
- Analysis Driven Optimization
- Understanding Performance Limiters
- Metrics Review
- Memory Bound Analysis
- Compute Bound Analysis
Goals Make efficient use of memory subsystem Expose enough parallelism to hide latency
Analysis Driven Optimization
Cyclical process
- Profile
- Determine Limiter
- Inspect
- Optimize
Determine if memory or compute bound. If neither, analyze where the latency is coming from.
Metrics
Latency
- sm efficiency
Memory
- dram utilization
- L2 utilization
- shared utilization
Compute
- DP utilization
- SP utilization
- HP utilization
- TC utilization
- Integer